Analytics
Content Analytics
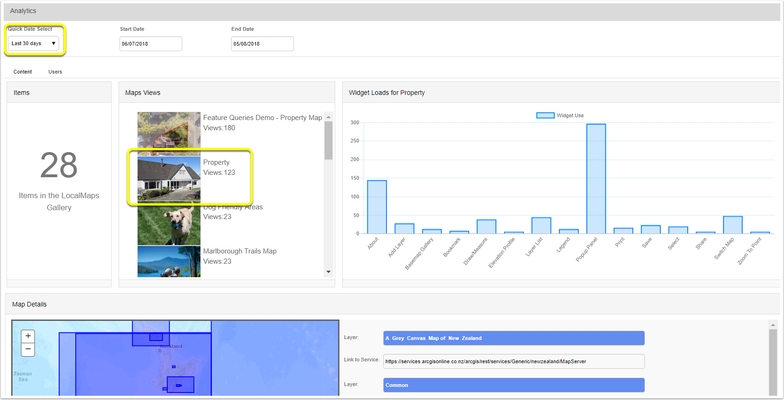
Contents analytics provides administrators with insight into what maps are being loaded, how many times they have been viewed and when as well as what widgets are being used. The Quick Date Select can be used to filter results to a defined time period.
The Contents Analytics page is divided into a series of panels.
- Items: Count of how many items are in the LocalMaps Gallery.
- Map views: How many times each map has been loaded in the defined time period.
- Widget Loads: How many times each widget has been loaded in the selected map.
- Map Details: On the left, a map showing the extents of each service in the map. On the right, the service names and Rest URLs.
Click on a thumbnail to see analytics for that specific map update on the surrounding graphs.
Example analytics for a selected map.
User Analytics
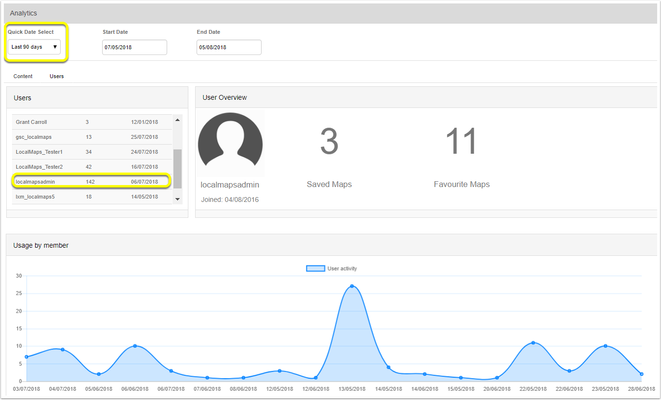
The User Analytics tab delves deeper into who is logging into LocalMaps and when, along with what maps they are viewing most regularly. This page is split into three main panels.
- Users: A table of every user that has logged into LocalMaps, how many maps they have viewed and when they last logged in.
- User Overview: Once selected from the table, this user overview provides information on when they joined, how many maps they have saved and favourited.
- Usage by member: Graph showing member usage overtime.
To view specific user analytics, choose a quick date and then select a User from the table.
Example of a selected user.
Note
If you select a new Quick Date you will need to reselect the user from the table to see updated analytics.

